|
|
|
|
|
|
|
|
|
|
|
|

Last Update: 13-MAY-07
Personal Cycling Trivia,
Training Logs, Tips, Testing, and Philosophical Ramblings on Various Topics.
This page contains a
collection of odds-and-ends info some folks may find interesting. Since taking a job with BAE Systems in 2001
and meeting a certain individual who loved keeping stats on things, I too
caught the bug and started a training log.
I believe this has helped me tremendously in achieving higher levels of
fitness with the many constraints I must train within. In keeping a detailed Excel spreadsheet log,
it is easy to keep track of certain accomplishments and records. These are highlighted here. Nothing too extraordinary, other than maybe
biking up possibly the biggest vertical bikeable climb in the world, Mauna Kea
on the big island
2005 UNH VO2max Test and NAC Study
Road Cycling Records
- Longest Ride: 202.5 miles in 10:05:10 during the Granite State Wheelman's Seacoast Century, September 2002.
- Fastest Double Century: 200 miles in 9:56:44, last 100 miles solo, during 2002 Seacoast Century.
- Fastest Century: 4:42 with wife on tandem during 2003 GSW Seacoast Century.
- Fastest Solo Century:
4:55 from
- Highest Group Training Ride Average: 24.9 mph on hilly 47 mile Exeter Cycles training ride, including warm-up/cool-down miles.
- Highest TT Average Speed: 26.3 mph on 3.25 mile "Prologue" TT loop at work, incl. two hills and two RH turns on std road bike.
- Highest Speed: 56.0 mph down 12% grade east side of Kinsman Notch in northern NH.
- Best Mt
- Maximum Climbing Rate: 4613 ft/hr or 1406 m/hr on 2250 foot vertical Mt Ascutney.
- Most Road Miles in Calendar Year: 7733 miles in 2003.
- Biggest
Vertical Climb: 13,790 feet up Mauna Kea on
Mountain Biking Records
- Longest Ride: 70.0 miles in 8.6 hours, Maah Daah Hey Trail in the Badlands of North Dakota, May 2003.
- Best
- Most Dirt Miles in Calendar Year: 3180 miles in 2002.
- Biggest
Vertical Climb:
Combined Riding Records
- Most Miles in Calendar Year: 10652 miles in 2002.
- Most Rides in Calendar Year: 389 rides in 2002.
- Most Miles in One Week: 324 miles, September 2002.
- Most Rides in One Week:
10 rides, November 2002 in
- Most Century+ Rides in Calendar Year: 6 in 2002.
- Most Consecutive Riding Days: 206 days, May 2002 to December 2002.
- Most Days Ridden Outdoors in One Year: 360 days in 2002.
- Most Accumulated Climbing
in One Ride: 14,500 feet,
- Runner up:
13,790 feet, climbing Mauna Kea on
- Maximum Elevation:
14,135 feet above sea level on Mt Evans,
- Runner up: Mauna Kea, 13,790 feet, Hawaii, April 2005
- Lowest Elevation: Sea level in NH, ME, MA, VA, HI, AK, and CA.
Cycling
Statistics, Summary by Year:
Cycling
Statistics, 2006:
Complete 2006 Training Log
Follow this link to view my complete training log of the 2006 calendar year. I use Microsoft Excel to log important facts from all activities. I believe this is important for several reasons if one is serious about improvement as an athlete. First, it forces you to think about what you are doing and why you are doing it. You will begin to recognize patterns, like when you have stellar rides and when you have lousy rides. Stellar rides don’t have to happen by accident. Proper cycles of hard and easy workouts increase fitness. Too high a density of hard riding will result in overtraining, making a good race result, pleasant century, or whatever, hard to achieve. Then again, too many easy or moderate paced rides without a couple high intensity workouts per week will also result in poor fitness gains. Keeping track over time lets you go back and see how many hard rides you did per week. It is very important to capture how you felt for each ride, your perception of how hard the ride was relative to how hard it really was (based on HR, power, or others’ perception), and some heartrate or power data if you use these valuable tools.
Another reason to record data from your training sessions is you capture what works and what doesn’t. If you record detailed data of training sessions leading up to an important race, the next season you can go back to see why you had a good or bad race. You want to repeat and improve on training patterns that produce desirable results, and move away from patterns that produced poor results. It’s way too easy to forget how much of what kind of training you did before, say Mt Washington two years ago when you set a PR. Write it down, preferably electronically, keep it around, and review it from time to time. Sounds geeky, and you can get carried away or burnt out on this, but it has helped me considerably. One area it has helped me the most in is tapering for a big race. I’ve learned what I do two days before a race is more important than three days or one day before a big race. The second day before is the most important recovery day for me. I tend to be most successful race day with a very light, <60% MHR 30 minute spin two days before. I will do a longer ride with a few short bouts of moderate intensity the day before a race.
From the yearly summaries above, you can see I’ve been cutting back annual riding mileage about 1000 miles per year, from 10,600 in 2002, 9,700 in 2003, down to 8,700 in 2004. Yet each year, my fitness has improved as determined in hillclimb time trials. In 2004, when I rode the least miles in several years, I set new personal records on every hillclimb time trial attempted. In 2002, I was putting in way too many “junk” miles. Riding so many hours per week did not allow adequate recover for really hard workouts. In 2003, some of the reduction in miles were a result of taking up skate-style cross country skiing, but very high cycling volume resumed in the warm months, again, preventing a necessary density of high intensity workouts. Then in 2004, I backed completely away from the idea of being a 10,000+ mile per year cyclist and started focusing on improving power output for long 20+ minute durations. I found this could only happen if I reduced weekly training volume, such that two easy short days were required to precede a hard workout day if I wanted to gain any benefit. I used the skiing to maintain cardio base over the winter, a few long endurance rides in the spring, but then quickly went to a two to three intensity sessions per week regimen. Most non-intensity days were active recovery days, short duration conversation pace rides. Studying training methods and logging workouts led to a strategy that works for me.
VO2max Test at
I volunteered for a
study a graduate student was conducting for her Master’s thesis. The name of her study was “The Effect
of N-acetaylcycsteine on Cycling Performance in the Heat.” Now this got my attention for two
reasons. The first, it would get me a
free VO2max test. Secondly, I knew I had
serious problems in the heat, so I might learn some valuable things about
myself during this study. The main
purpose of the study was to show that the anti-oxidant NAC can improve athletic
performance in the heat. NAC can be
bought over the counter at vitamin stores, and body builders often use it. It is also used intravenously for
acetaminophen and other overdoses to save the liver. It’s been around a while, and it’s
safe. The study was set up as
follows. On the first visit, I come in
fully recovered with my own bike for a VO2max test. On the next four visits, I was to ride
simulated 30km time trials. The order
was randomized, and one per week was to be run.
The four combinations were 1) placebo at room temp, 2) NAC at room temp,
3) placebo at 95F, and 4) NAC at 95F. Of
course, I didn’t know placebo from NAC.
The capsules were in color-coded bags.
Two days before a TT, I would take 800mg, another 800mg day before, and
another 800mg 30 minutes before TT.
The VO2max test was
to establish baseline fitness, as the study required athletes that were in
active training throughout the winter.
My bike was placed in the university’s CompuTrainer Pro in a small
environmentally controlled room. The
test was conducted at room temp with fans blowing on me. A fairly large tube was strapped to my mouth
to breathe through, and my nose was pinched shut. The apparatus measures O2 going in and CO2
going out, basically how much oxygen you are consuming. After a warmup at low wattage, the test is
begun. The test started out at about
225W per my PowerTap and increased 50W every two minutes. I made it to 12 minutes, or just about ready
to kick into 525W. My max HR achieved
was 185bpm, the same as when I did a similar test 3.5 years earlier. VO2max reached at 10.5 minutes into test was
75.9 mL/kg/min, and incredibly high value for an amateur 42 year old
athlete. The talked to Dr. Edwards, the
advisor on this research study, about this result. He commented they recently tested a local
elite skier. She also came in a little
higher than what she tested at a different lab.
Dr. Edwards felt the single-point calibration method their equipment
uses is limited and can be prone to some error, but he did not expect it to be
off more than 4 or 5 mL/kg/min. This
would still put me above 71 mL/kg/min.
Dr. Edwards also commented that given my training volume of cross
country skiing over the winter, a high VO2max can be expected.
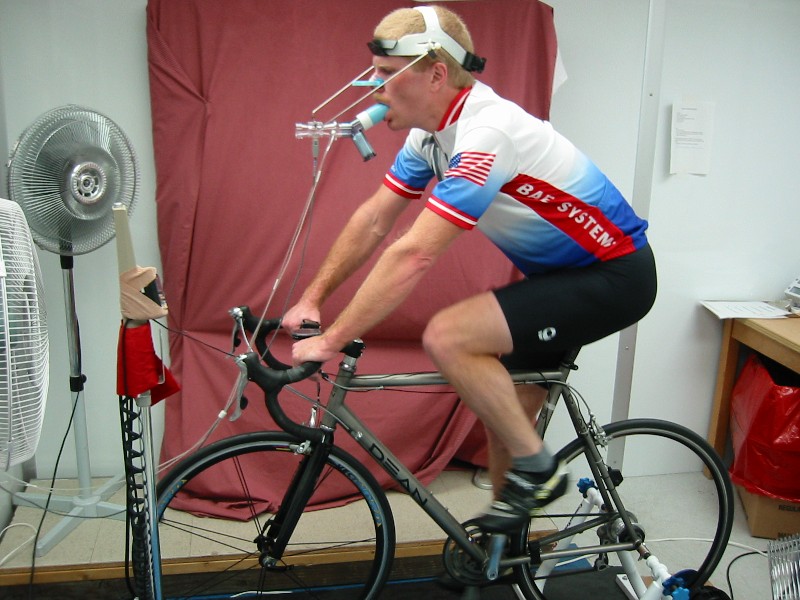
VO2max Test. Dean
El Diente equipped with PowerTap in the
CompuTrainer Pro.
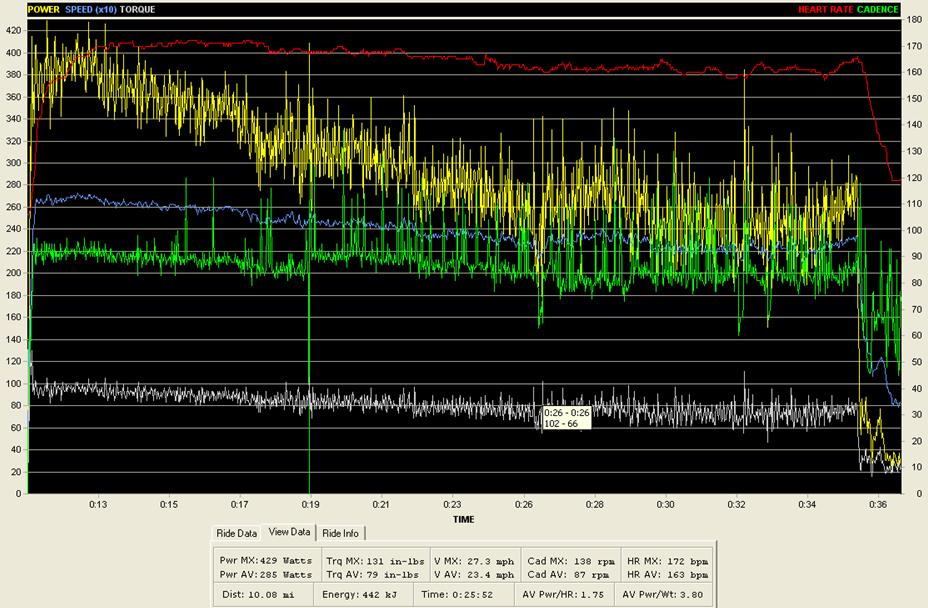
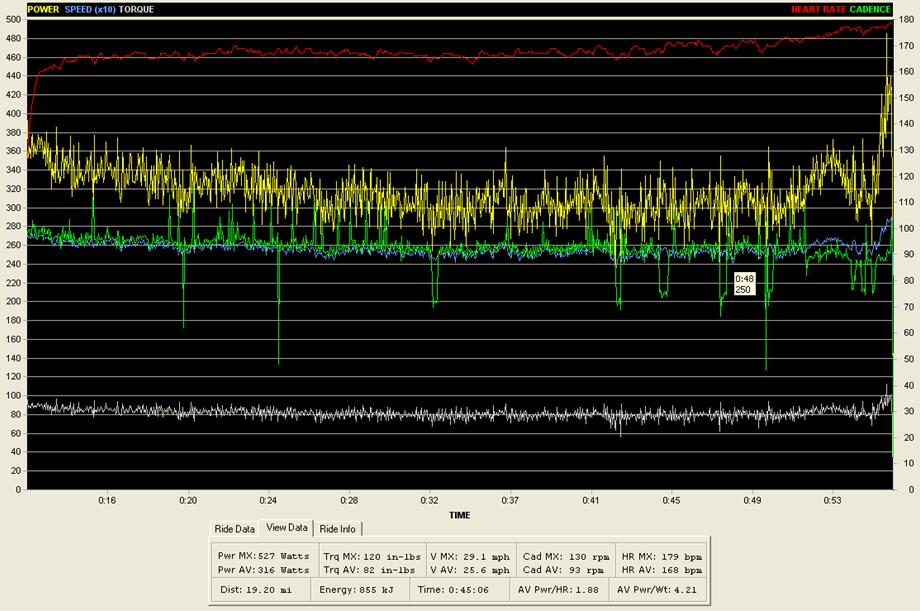
The next two charts
show PowerTap and SensorMedics Vmax 229 metabolic cart data. Note heart rate and power increase linearly
while cadence holds steady around 85rpm until


So this was the
first visit. My next visit to the lab
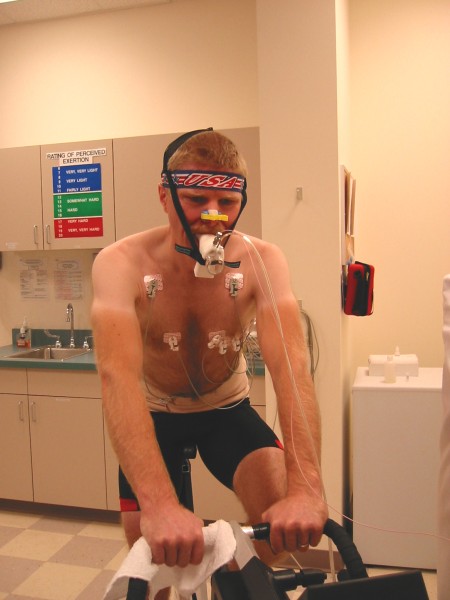
was to be a 95 degree 30km TT. Now it
has been a cold winter, so I had absolutely no acclimation to heat with all the
outdoor skiing was doing. I do not train
indoors. For the TTs, it was imperative
that the test subjects arrive fully hydrated.
This meant drinking lots of water in the 24hr window leading up to the
test. Upon arrival, I was handed a small
bottle for a urine sample. I believe
they measured the specific gravity to determine how dilute my urine was. I think I was 1.004 on first visit. Cutoff was 1.02 if I recall correctly. I was well hydrated. Blood is drawn, I “instrument
myself” with a temperature probe (you’ll have to use your
imagination here), and I’m wheeled in wheelchair into the heat
chamber. It 95F during ski season was
HOT. But it was a dry heat. I had to wait 30 minutes to acclimate, then
blood is drawn again, then I begin warm up on bike. I start the TT feeling pretty good. But it didn’t take long until I
couldn’t keep power up.
Wasn’t like I was dying or anything, I was just slowing down. Then the research team tells me I’m
going to have to keep my body temp down.
I don’t think I intentionally let up, I just couldn’t help
it. Then I hit the safety limit of 39.5C
for core body temp and they stopped the test.
This happened only 20 minutes into it.
My core temp peaked at about 103.5F, a scary high level. Strangely, I felt hot, but not ill in any
way. I could produce only about 1/2 LT
power at this body temp. I was very
disappointed, mostly for Melissa who had trouble finding volunteers for her
study. She discussed this with Dr
Edwards, and they concluded there was still value in me completing the room
temp TTs.
95F TT. Core body
temp reached 39.5C in 24 minutes despite rapidly dropping power. Note plot above does not start at zero.
The following week I
come back for a 68F, 25% RH TT. I was
actually shivering in the room during the 30 minute acclimating session.
Successful 30km TT at room temp. Started out a little hard maybe, but nice
rising HR profile. Dips in green cadence
line are
where I up-shifted two gears to stand for several
seconds. Had lots of punch left at end
to drive HR to near max.
My 4th and final
visit was for another room temp TT. This
time I took the purple coded pills. No
idea which ones were NAC or placebo. This
TT didn’t go as well. Legs
didn’t feel as fresh as a week earlier, even though I tapered, rested,
and dieted exactly the same for both TTs.
I could only assume the pills were a factor, either I was taking placebo
this time and I was realizing my natural crappy self, or I was taking NAC, and
it’s a detriment to my performance.
I still don’t know as of June ’05, as I haven’t heard
back from Melissa yet on the conclusion of her study. A averaged only 300
Lactic Profile from 2001 “Anaerobic Medley” Test
at
This data was
collected at the Human Performance Lab at
|
VO2max* |
63 ml/kg/min |
|
Maximum Heart Rate* |
185 bpm |
|
Anaerobic Threshold* |
167 bpm |
|
Power at Anaerobic Threshold* |
290 Watts |
|
Peak Anaerobic Power* |
1059 Watts |
|
Resting Heart Rate |
36 bpm |
|
Body Weight |
164 lbs/74.5 kg |
*As tested by the Human Performance Lab at
Doug on the Ergometer at the Human Performance Lab,